Application List

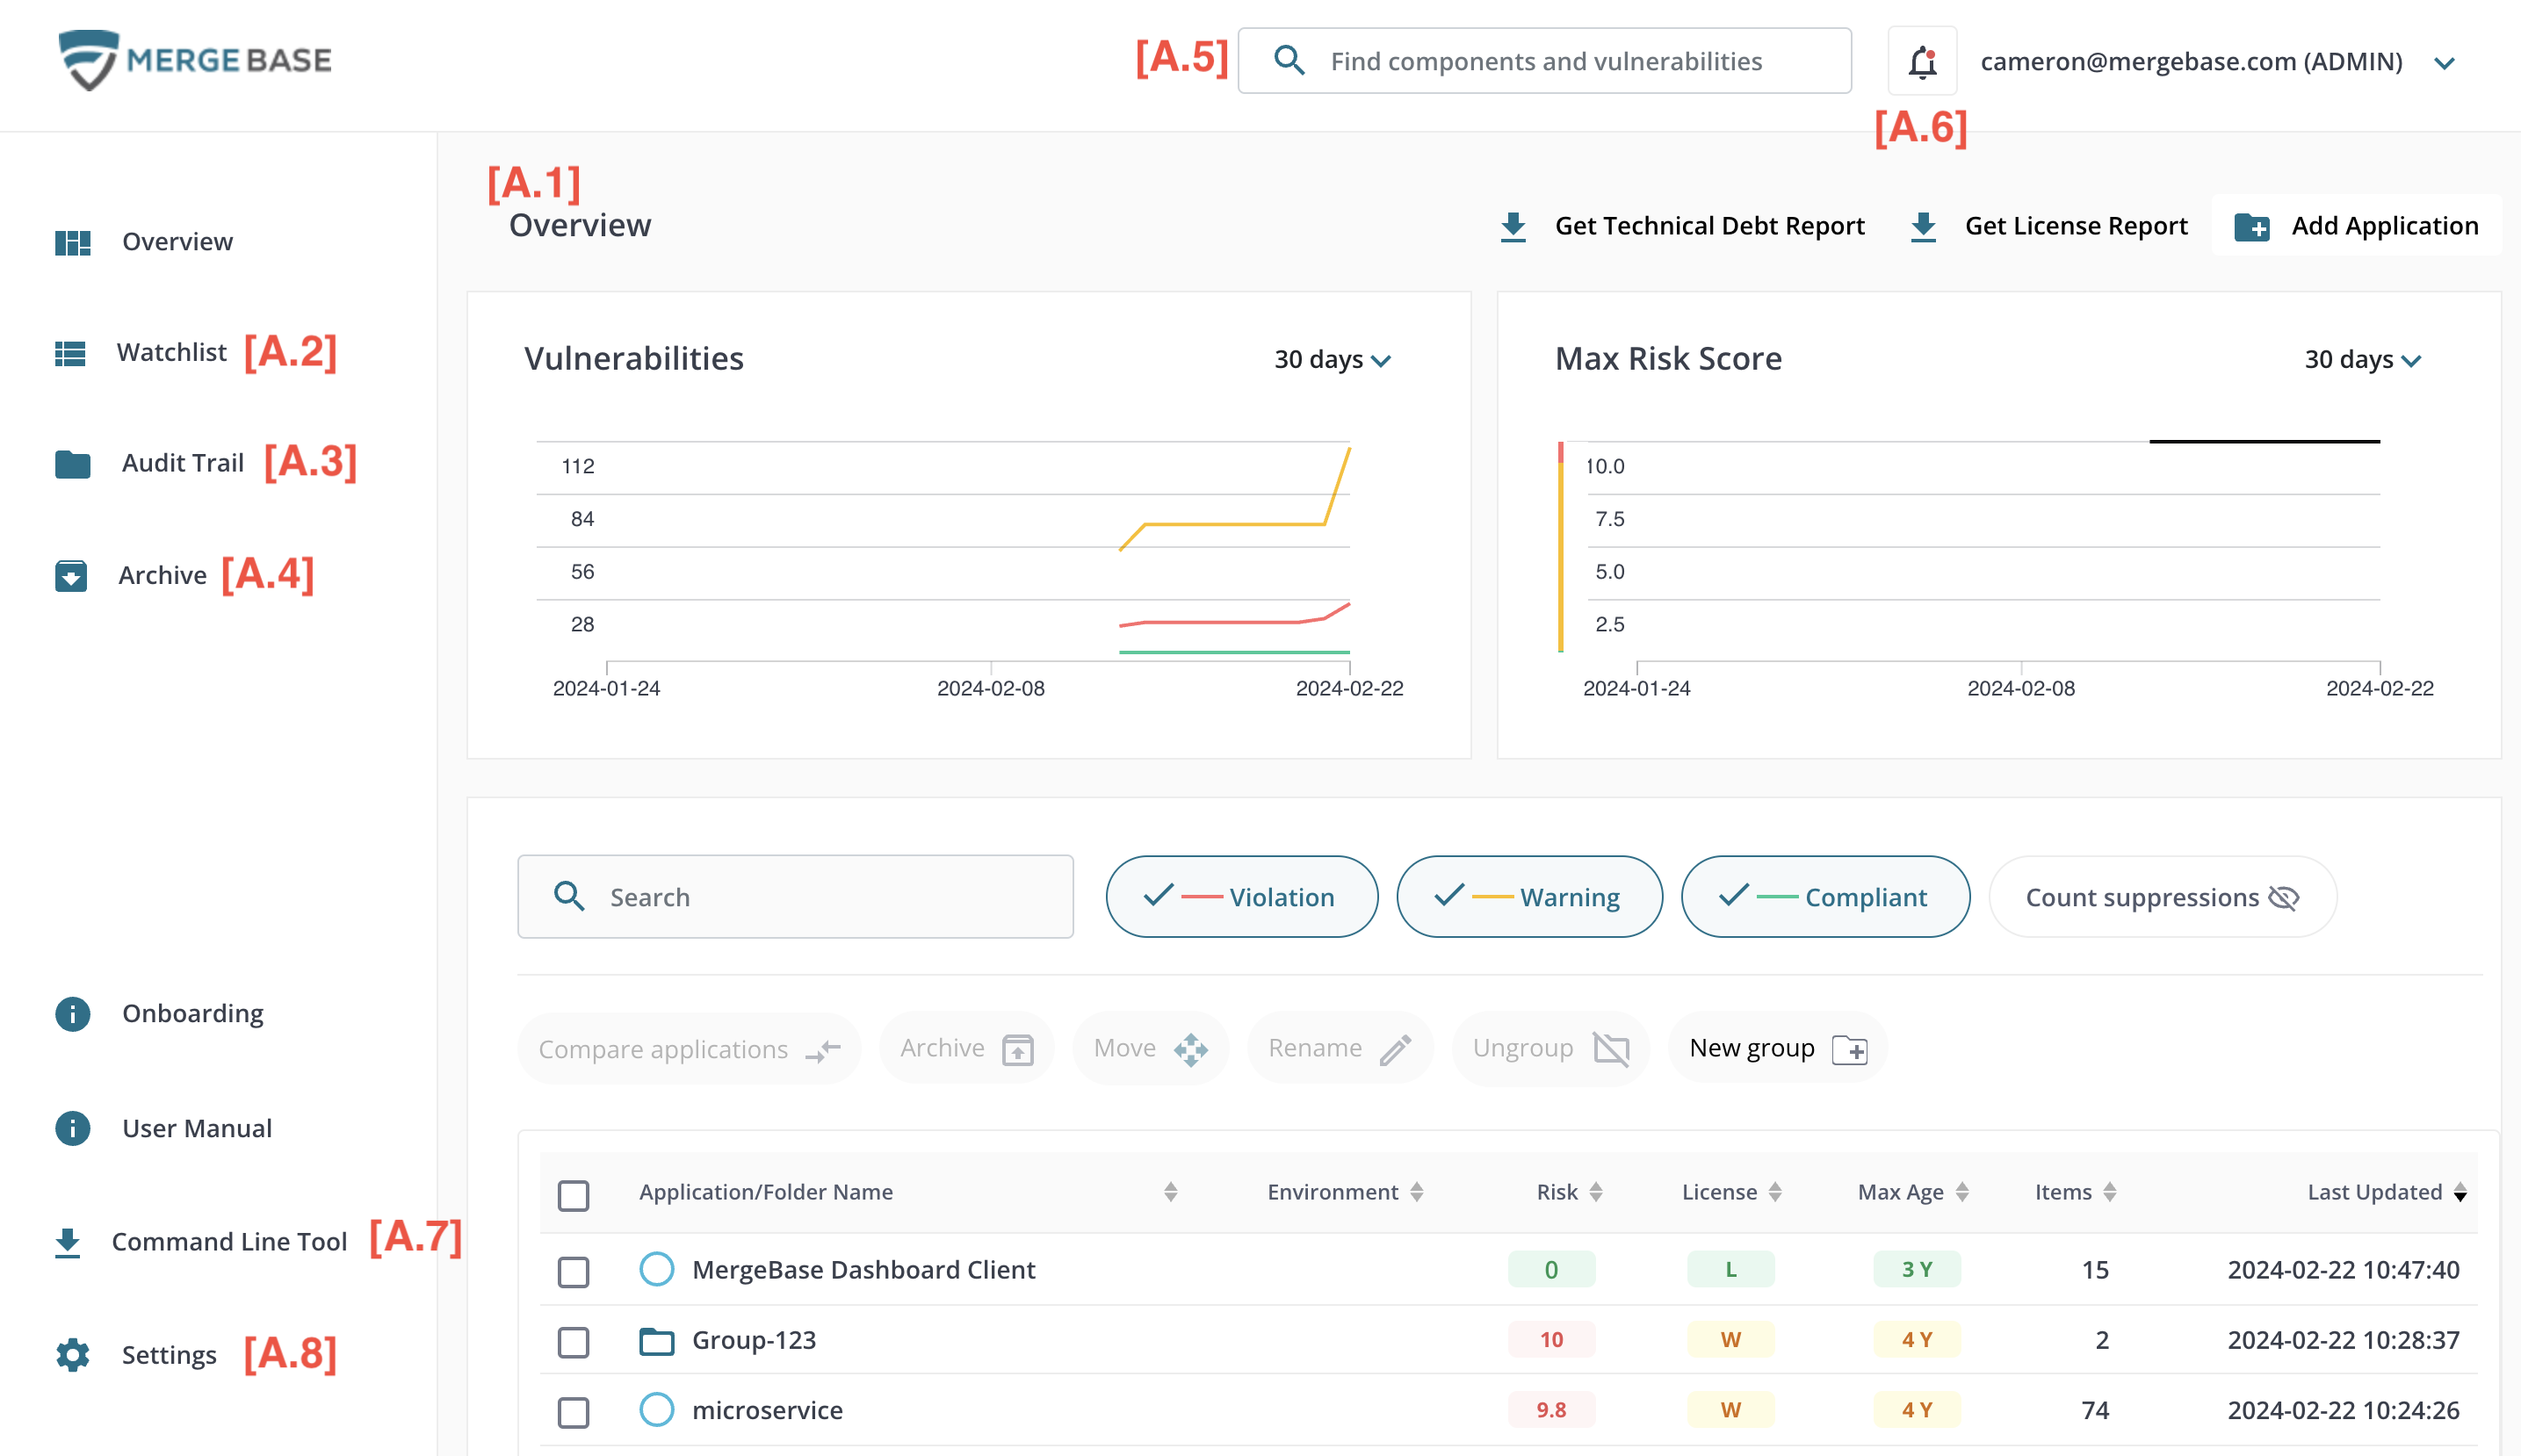
The MergeBase dashboard home page provides an overview of all the applications scanned and shows how risks are evolving over time. It consists of the main functional area (A.1), and navigation elements or utilities in the header and left sidebar (A.2 to A.8).
Application Overview
The Overview shows a set of graphs summarizing risk and vulnerability trends above a table of scanned and inoculated applications. A scanned application is produced by scanning an application binary or source code. An inoculated application is produced by applying MergeBase run-time protection to an application binary. For complete details on the difference between scanned and inoculated applications and how to create them, see the Command Line Tool section.

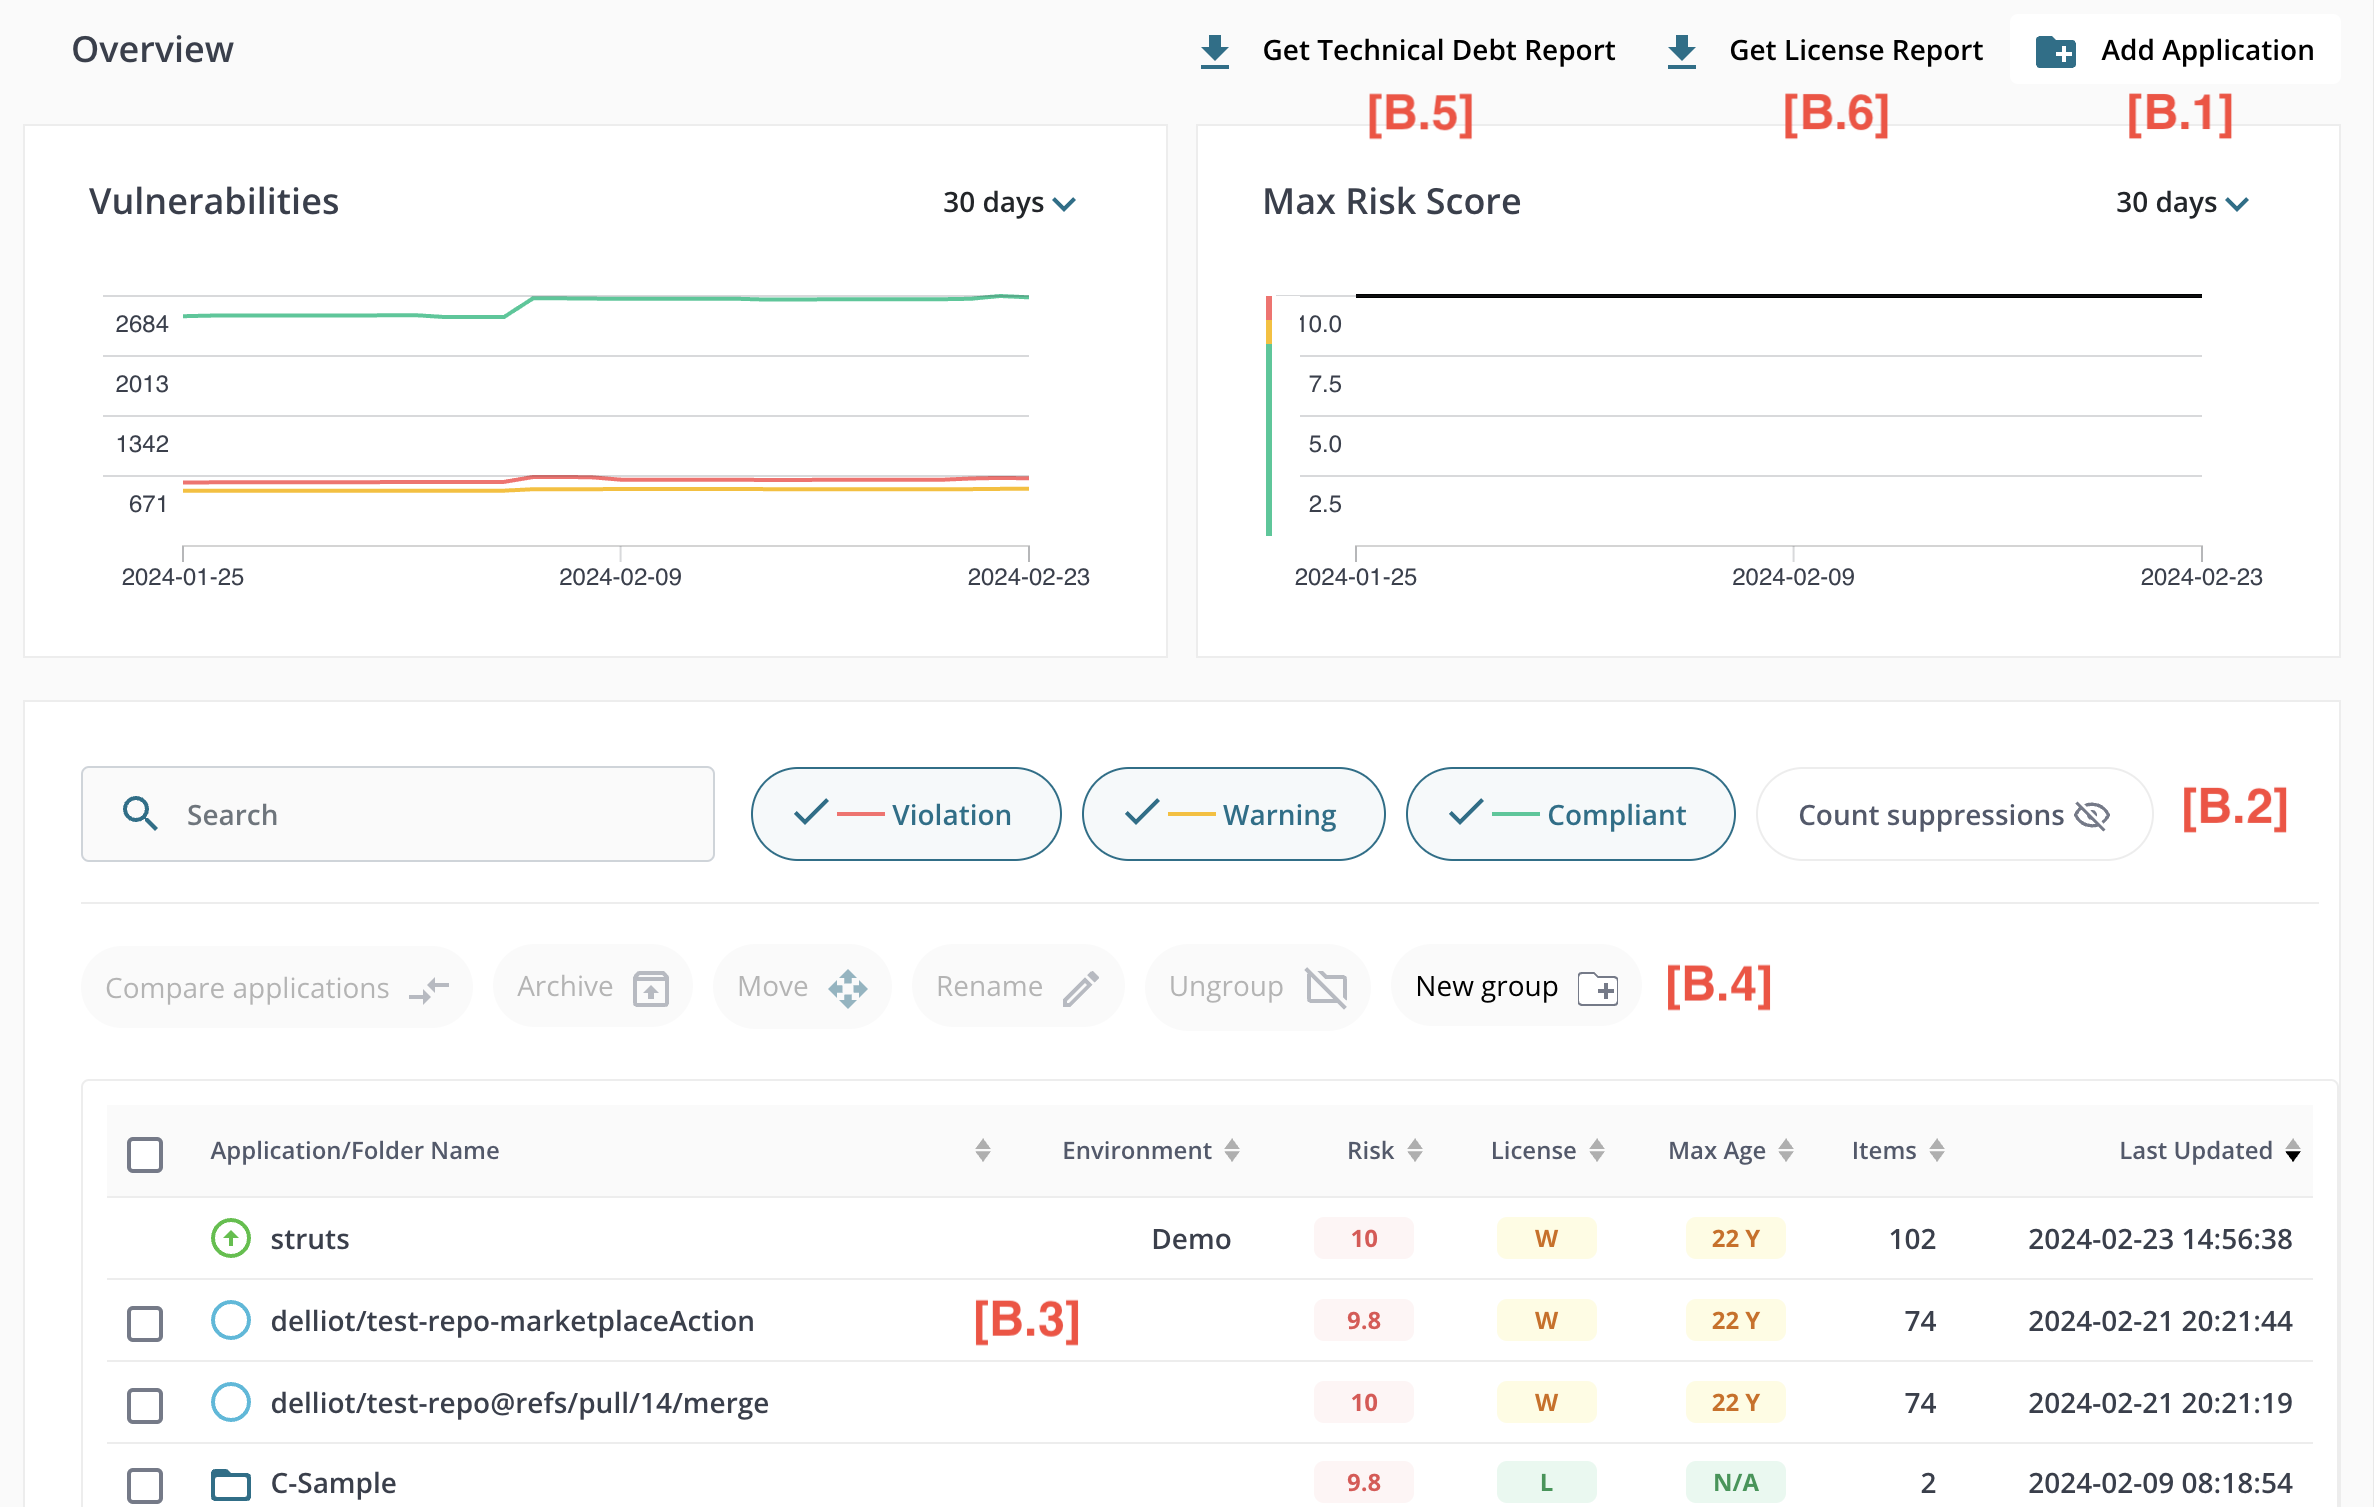
Add Application [B.1]
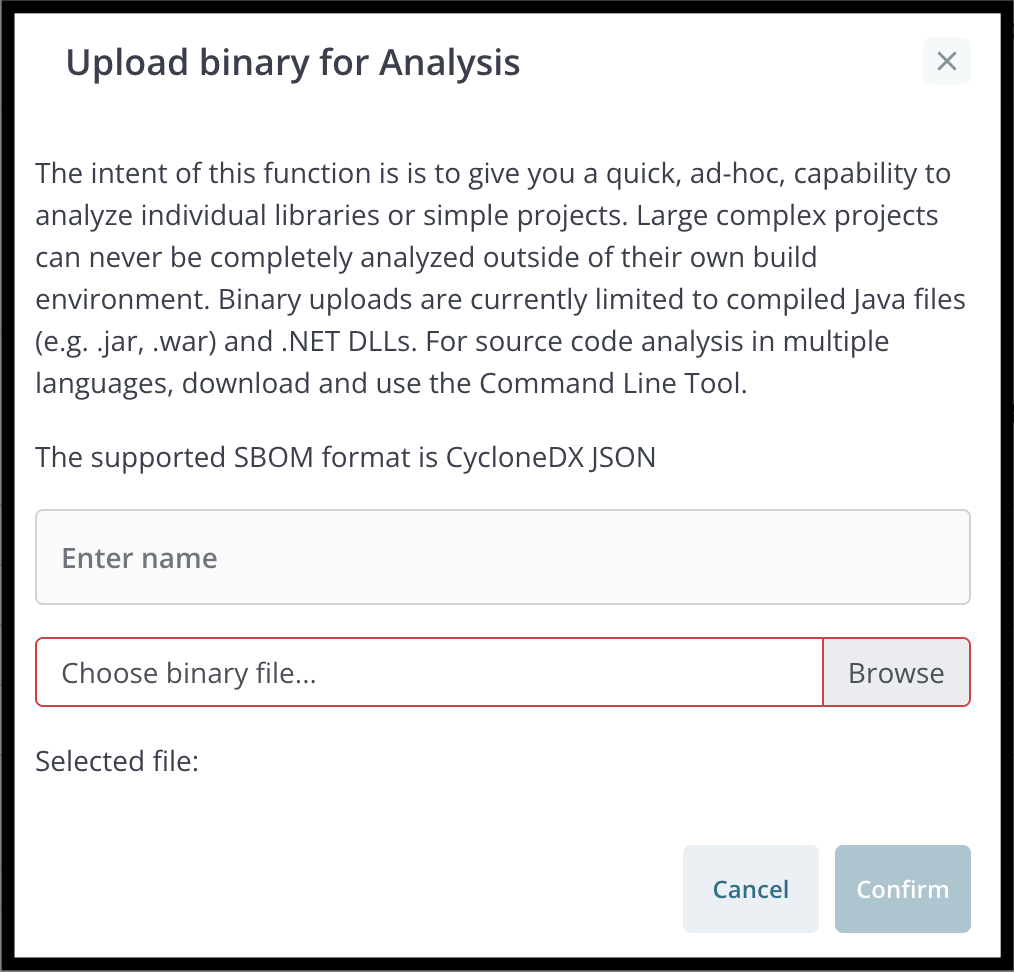
The Upload for Analysis function allows the user to upload a zip file or jar file for scanning. The file cannot exceed 200 MB. The upload feature is limited to analyzing compiled Java files (e.g. .jar, .war) and .NET DLLs. To scan source code in multiple languages, you must use the Command Line Tool.

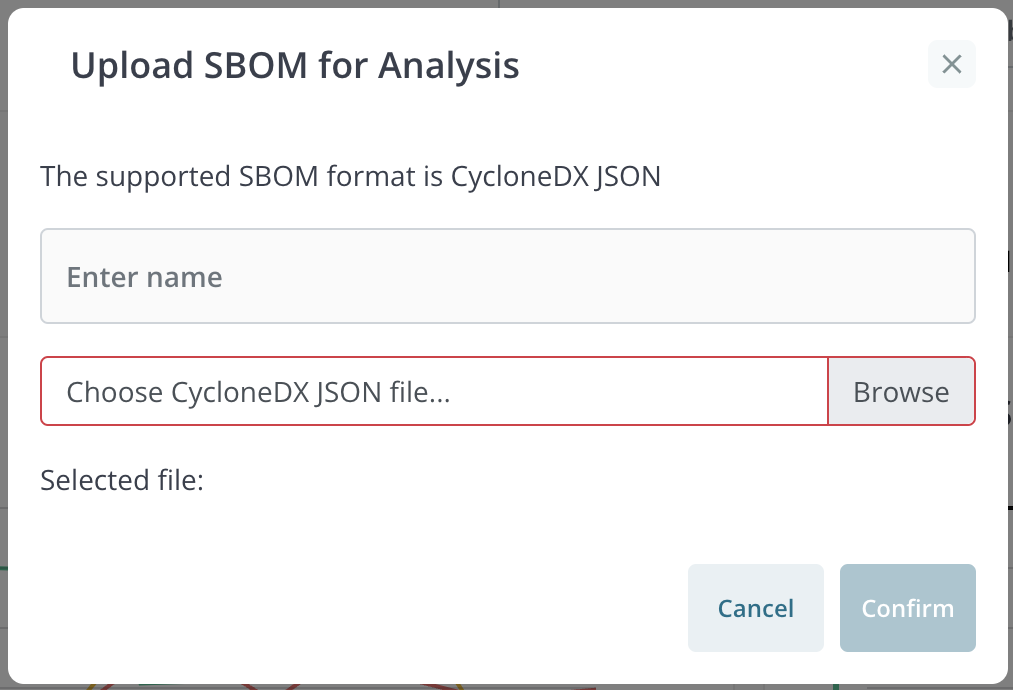
The Upload SBOM for Analysis function allows the user to upload SBOM files in CycloneDX JSON format.

Application Filters [B.2]
The application filters allow the user to filter the application list and graph data. There are three filters:
- Application name - filter by application name (case insensitive). Filters the list dynamically (as the user types). However, the graph data will not be updated until the user presses the enter key or clicks outside the filter.
- Environment - filter by environment label. This is a drop down list.
- Include mitigated and accepted risks - if checked, the graph data will include all vulnerabilities regardless of their risk mitigation status. Otherwise, the graphs are adjusted to take into account mitigations and risk suppression. See Application Detail - Inoculated Applications below.
Application Table [B.3]
- State: indicates whether the application is purely a scan (blue), a live inoculated application (green), or a “stale” inoculated application (yellow). An application is considered stale if it has not contacted the dashboard for one hour.
- Application name: the name provided when the application was scanned or inoculated
- Risk: a global risk score (based on the known vulnerabilities) and a license policy violation indicator (yellow = one or more policy warnings, red = one or more policy violations)
- Environment: for scanned applications, this is always “SCAN”. For inoculated applications, this is the value of the environment variable assigned in the running application (see Running Inoculated Applications below)
- Items: a count of the components used by the application
- Vulnerabilities: a count of the vulnerabilities detected
- Last updated: for scans, the time of the last scan; for inoculated applications, the time of the last communication between the dashboard and the inoculated application.
The table can be sorted by clicking on the column headers. Users can also filter the list by typing part of an application name (case insensitive) or selecting an environment label from the Environments dropdown menu.
Users click on a table row to view the details of an individual application.
Scanned applications and “stale” inoculated applications can be archived using the popup menu at the right end of each table row. Note that old scans will be automatically archived when new scans are uploaded. See the section on Automatic Archiving below.
Note that the combination of name and environment is a unique identifier for an application.
Application and Group Controls [B.4]
The Application and Group controls allow the user to perform the following actions:
- archive one or more applications and groups
- move one or more applications to a group
- rename an application or a group
- ungroup a group – moves all the applications in the group to the top level and removes the group
- create a new group
Reports
Technical Depth Report [B.5]
The Get Technical Depth Report button allows the user to download a CSV formatted report of obsolete components. There are two types of obsolete components: ones that have an age exceeding the update threshold and have a more recent release; and ones that have an age exceeding the abandon threshold and do not have a more recent release. The default values for these thresholds are ‘12 months’ for update and ‘48 months’ for abandon. The values can be configured in the Risk Policies section of the Setting page.
Notes:
-
The update threshold only triggers if the current component is older than the threshold and there is a newer release available. E.g., “Upgrade because this version is 13 months old (1 month past the 12 month threshold) and a newer version is available.” \
-
The abandon threshold ignores the current component version, and only triggers if the newest known version is older than the abandon threshold. E.g., “Abandon because there have been no releases in the last 48 months.”
License Report [B.6]
The Get License Report button allows the user to download a report of the licenses used by all open-source components in all applications. The report is in CSV format suitable for importing into a spreadsheet, for example.