Application Detail
The application detail view replicates the summary graphs of the Overview but applied to the selected application only. The table below the graphs contains the list of components found in the application.
List View
Application Detail - Scanned Applications - List View
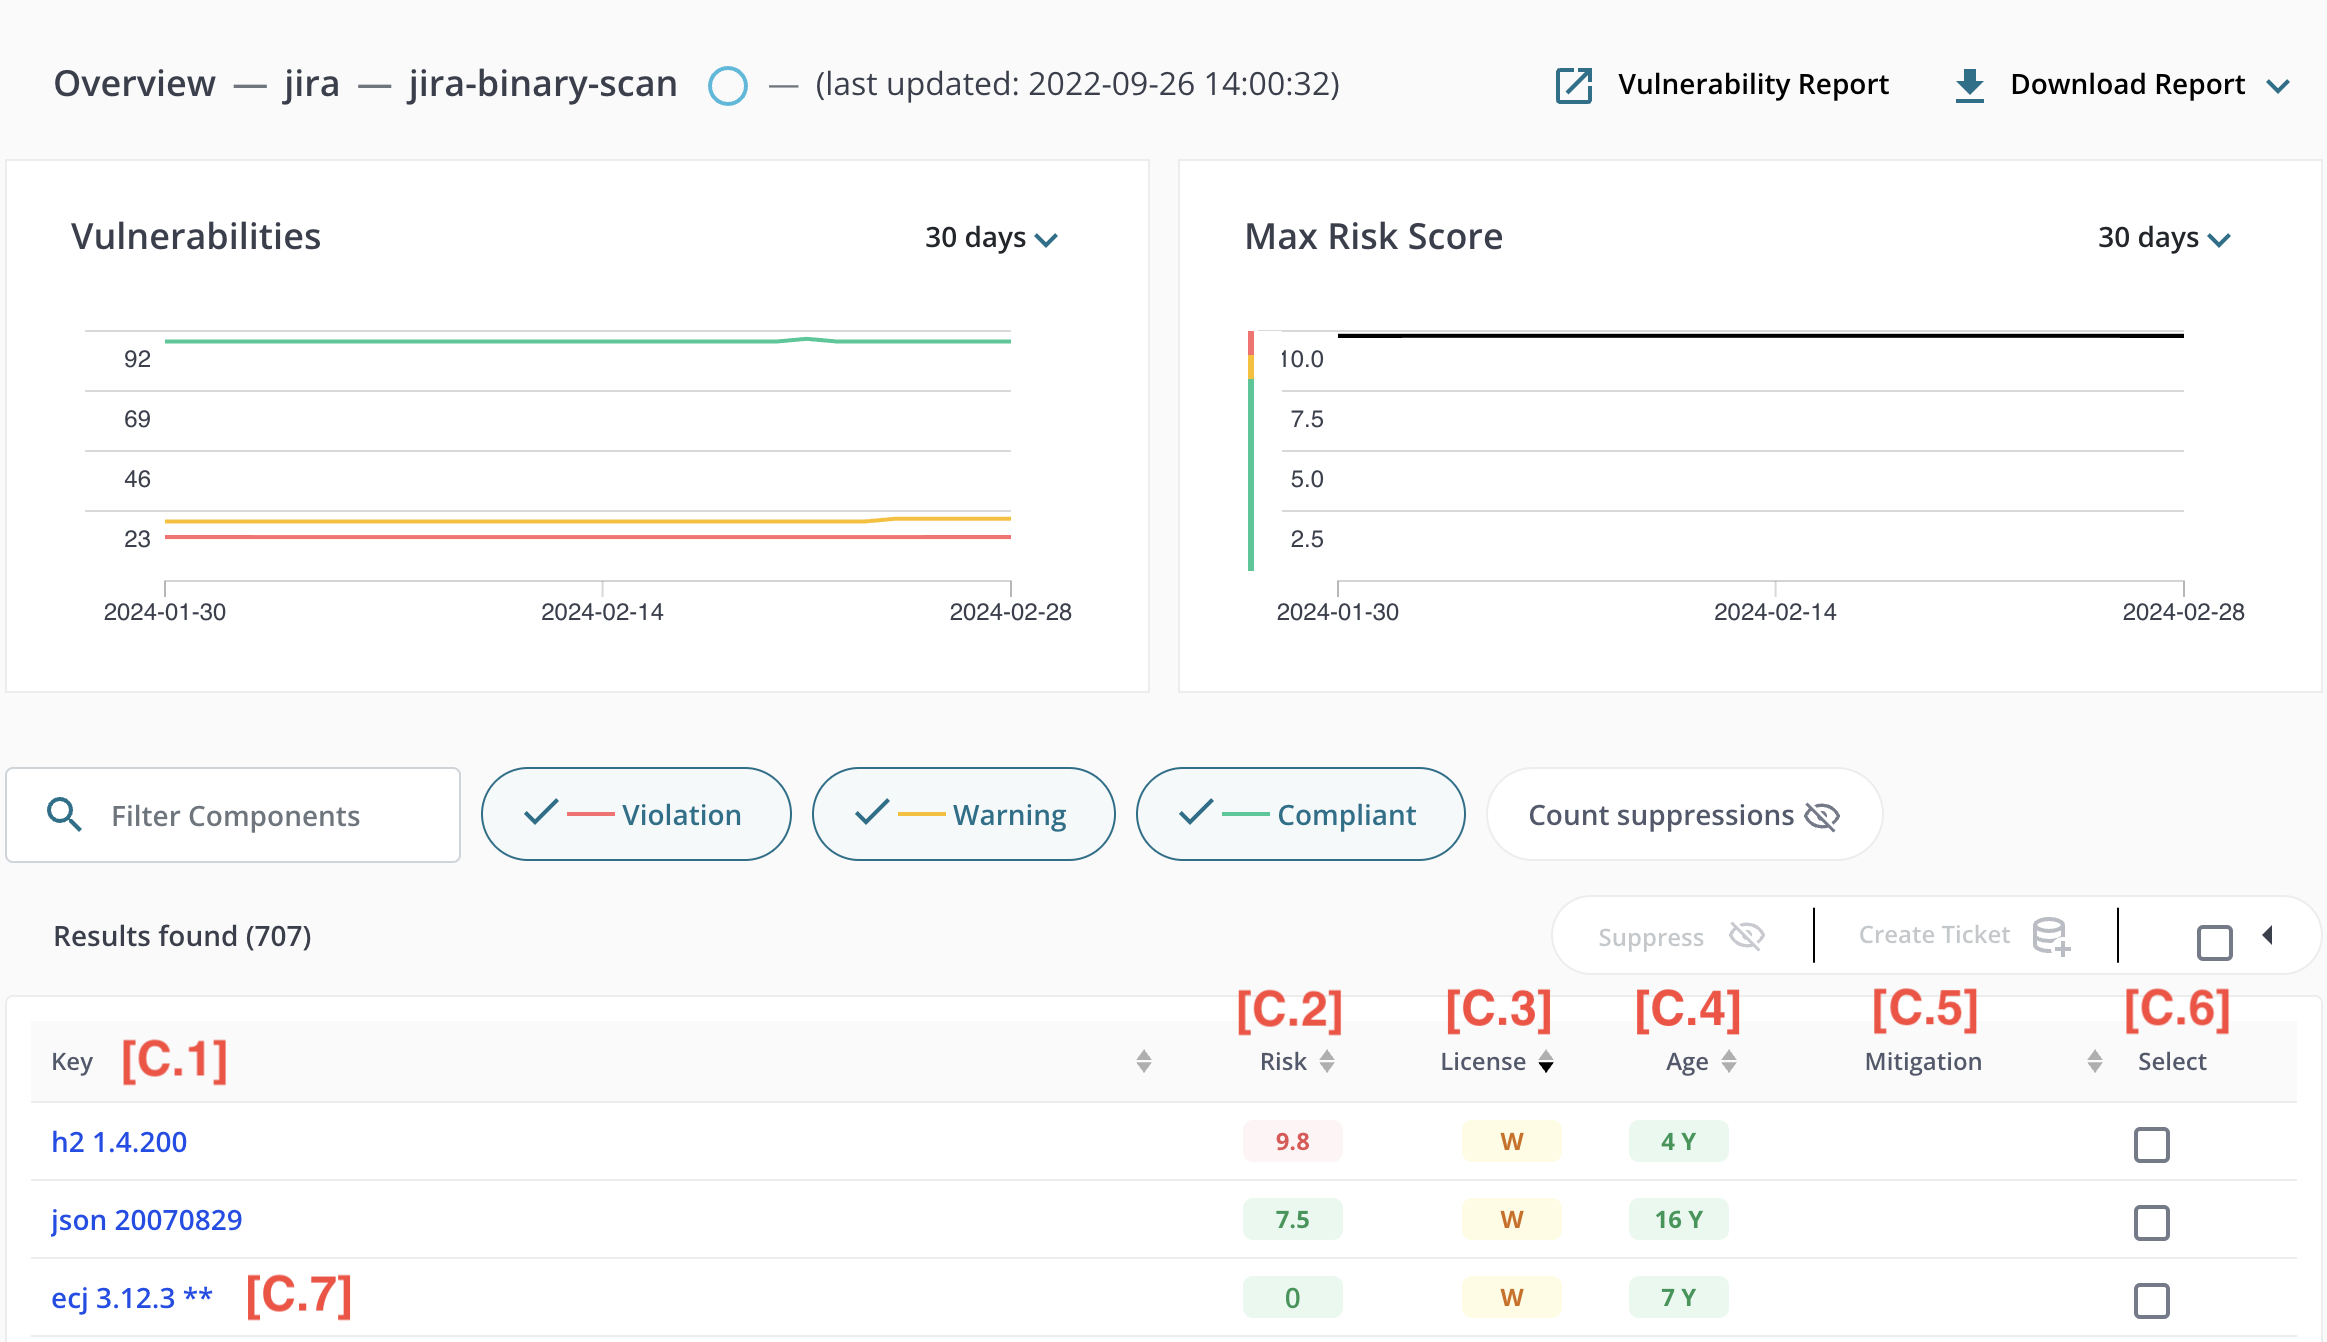
When using the list view the following information is displayed for each component:
- [C.1] - Key: the common name and version used for the component
- [C.2] - Risk: the risk level associated with the component
- [C.3] - License: license policy compliance status associated with the component. If the license is non-standard or unrecognized, it will be marked with a grey indicator.
- [C.4] - Age: the age of the component in years based on the original release date
- [C.5] - Mitigation: if Jira integration is enabled, this column will show if a ticket has been created for this component
- [C.6] - Select: allows the user to select multiple components to associate with a Jira ticket
Note regarding “[C.7] - Special components” - Unknown components and composite components (components the are comprised of multiple other components) are indicated with a double-asterisk (“**”) within their Key. Hovering the mouse over the double-asterisk provides additional information about these special components.
For a given component, users can temporarily suppress associated risk and license policy violations. They can also create a Jira ticket to assign and track patching work to a development team.
Structure View
Application Detail - Scanned Applications - Structured View (Tree View)
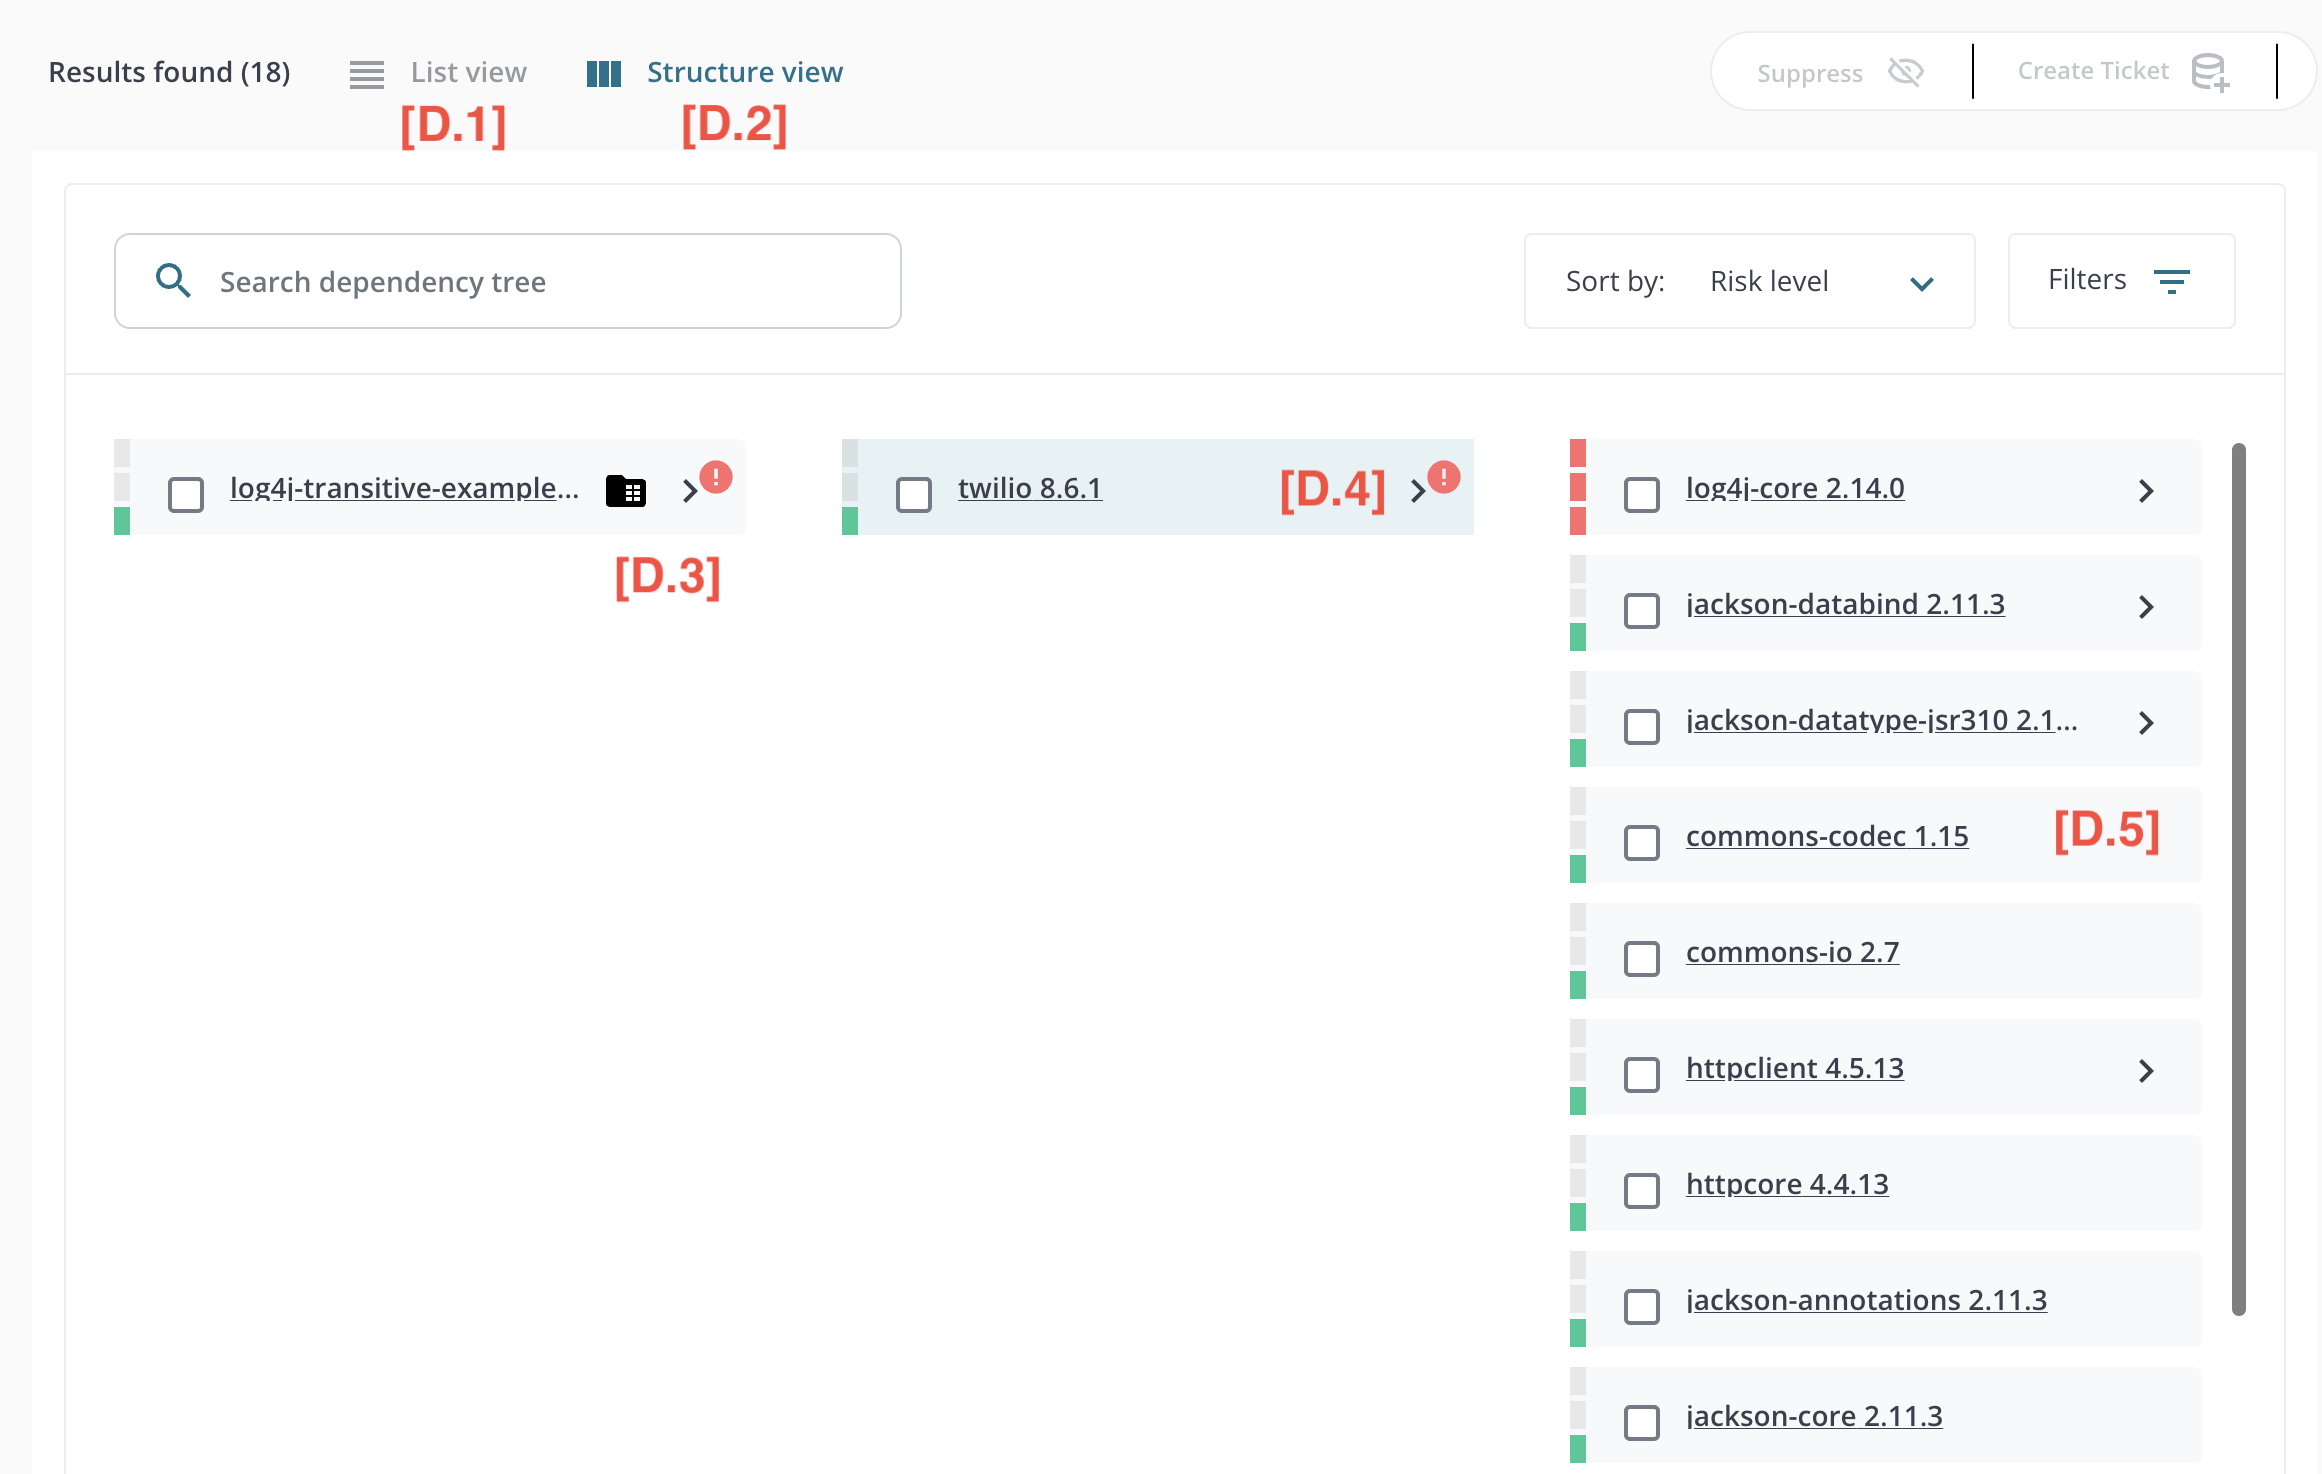
By default (after clicking on an application scan) the “list view” is presented, but users can toggle between the [D.1] list view and [D.2] structure view. Here we show a screenshot of the structure view.
The structure view uses a “Miller List” UI structure to help users understand the hierarchical dependency structure of their application. This structure view can be especially helpful when trying to determine what needs to change to execute a patch. D.g., Can we upgrade a vulnerable dependency directly? Or, since it comes in via transitive relationships, should we upgrade the parent dependency?
[D.3] - Sub-Dependency Expansion: click on the “>” icon to view a dependency’s sub-dependencies in the next column of the miller list. A small “!” icon (in a red circle) is displayed if vulnerabilities are present in sub-dependencies (or sub-sub dependencies, etc).
[D.4] - Vulnerable Sub-Dependencies: entries with a green indicator but a (!) yellow or red far-right indicator signify that while the dependency itself is not vulnerable, it’s sub-dependencies are.
[D.5] - Terminal Dependencies: entries lacking the “>” icon have no sub-dependencies.
Each item in the miller list is also decorated with a risk indicator (1 green square = OKAY, 2 orange squares = WARNING, 3 red squares = VIOLATION). The risk thresholds are based on vulnerability CVSS scores, and the OKAY / WARNING / VIOLATION thresholds can be adjusted globally in MergeBase’s settings. Note: the risk indicator only pertains to the dependency itself - vulnerable sub-dependencies are not incorporated into the risk indicator (vulnerable sub-dependencies are denoted via the “!” red circle instead).
Items marked with a “(D)” are duplicate entries, and that same dependency occurs in other places throughout the dependency tree.
Application Detail - Scanned Applications - Structured View (Tree View) - Filtering
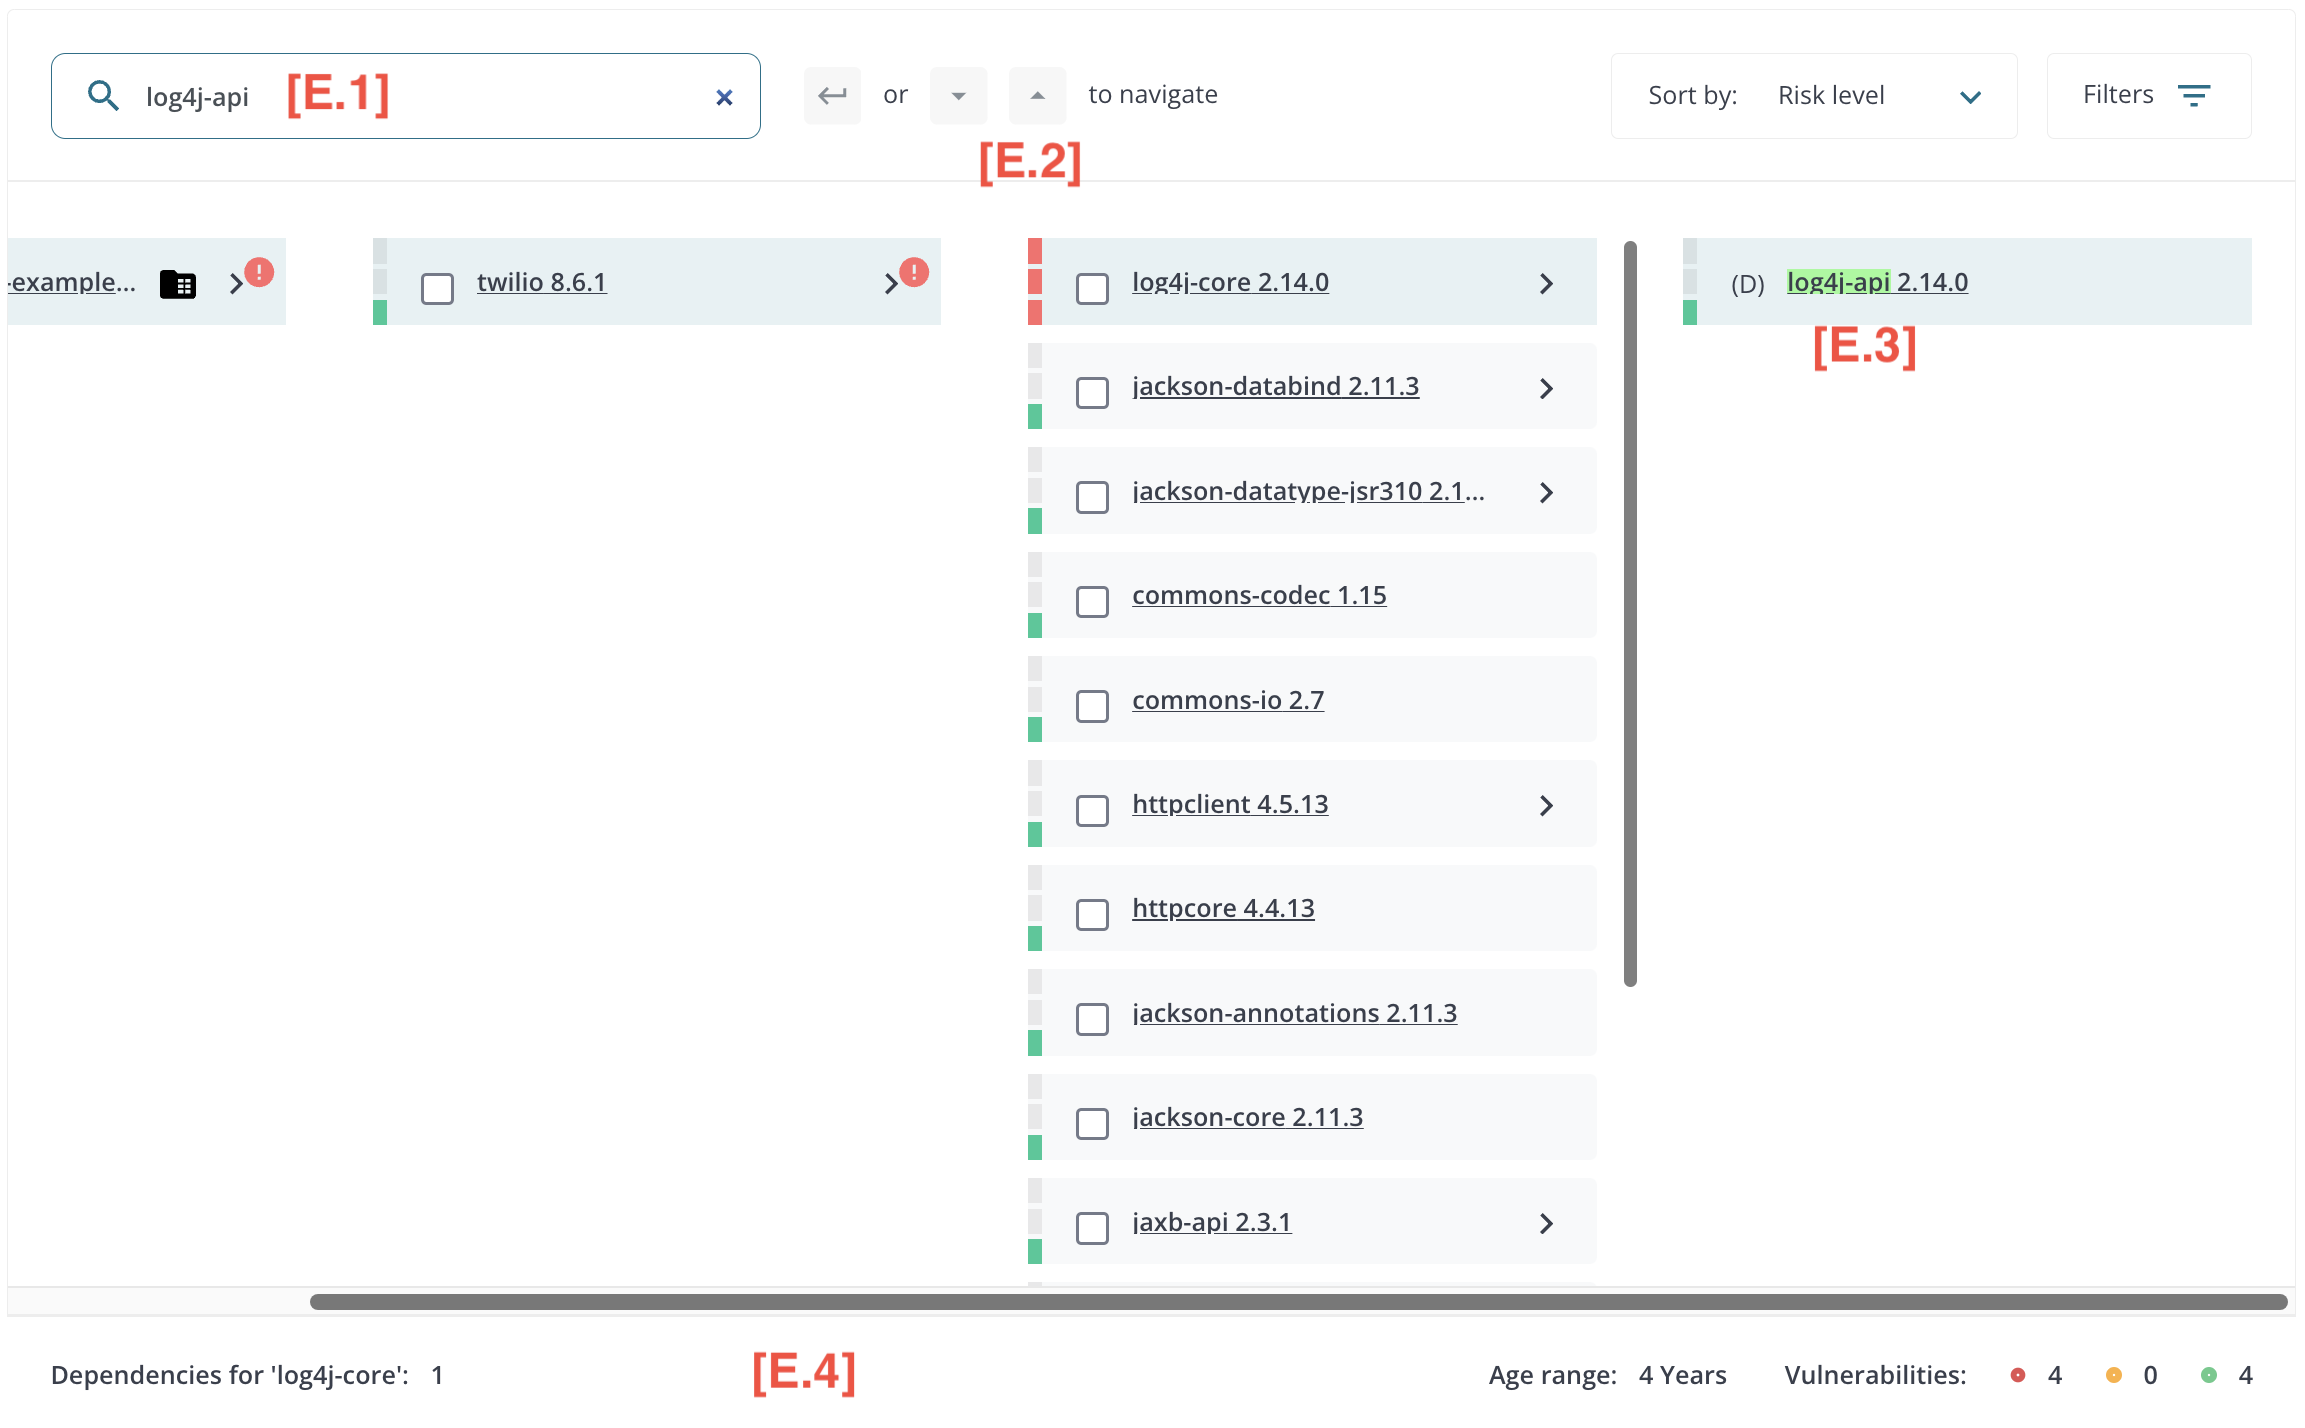
Users can quickly navigate large structure view using the [E.1] Filter Control. Type the text you wish to use to filter components and then use your keyboard’s [ENTER], [DOWN], and [UP] arrows to [E.2] navigate through [E.3] matches. Details of the highlighted component can also bee seen at the bottom of the page [E.4]. The navigation order is based on BFS (Breadth First Search). This means matching dependencies at depth 1 are matched first, and then dependencies at depth 2, and so on.
Reports
Vulnerability Report
The user can also click on “Vulnerability Report” to see a summary report of vulnerabilities. The report will open in a separate browser tab.
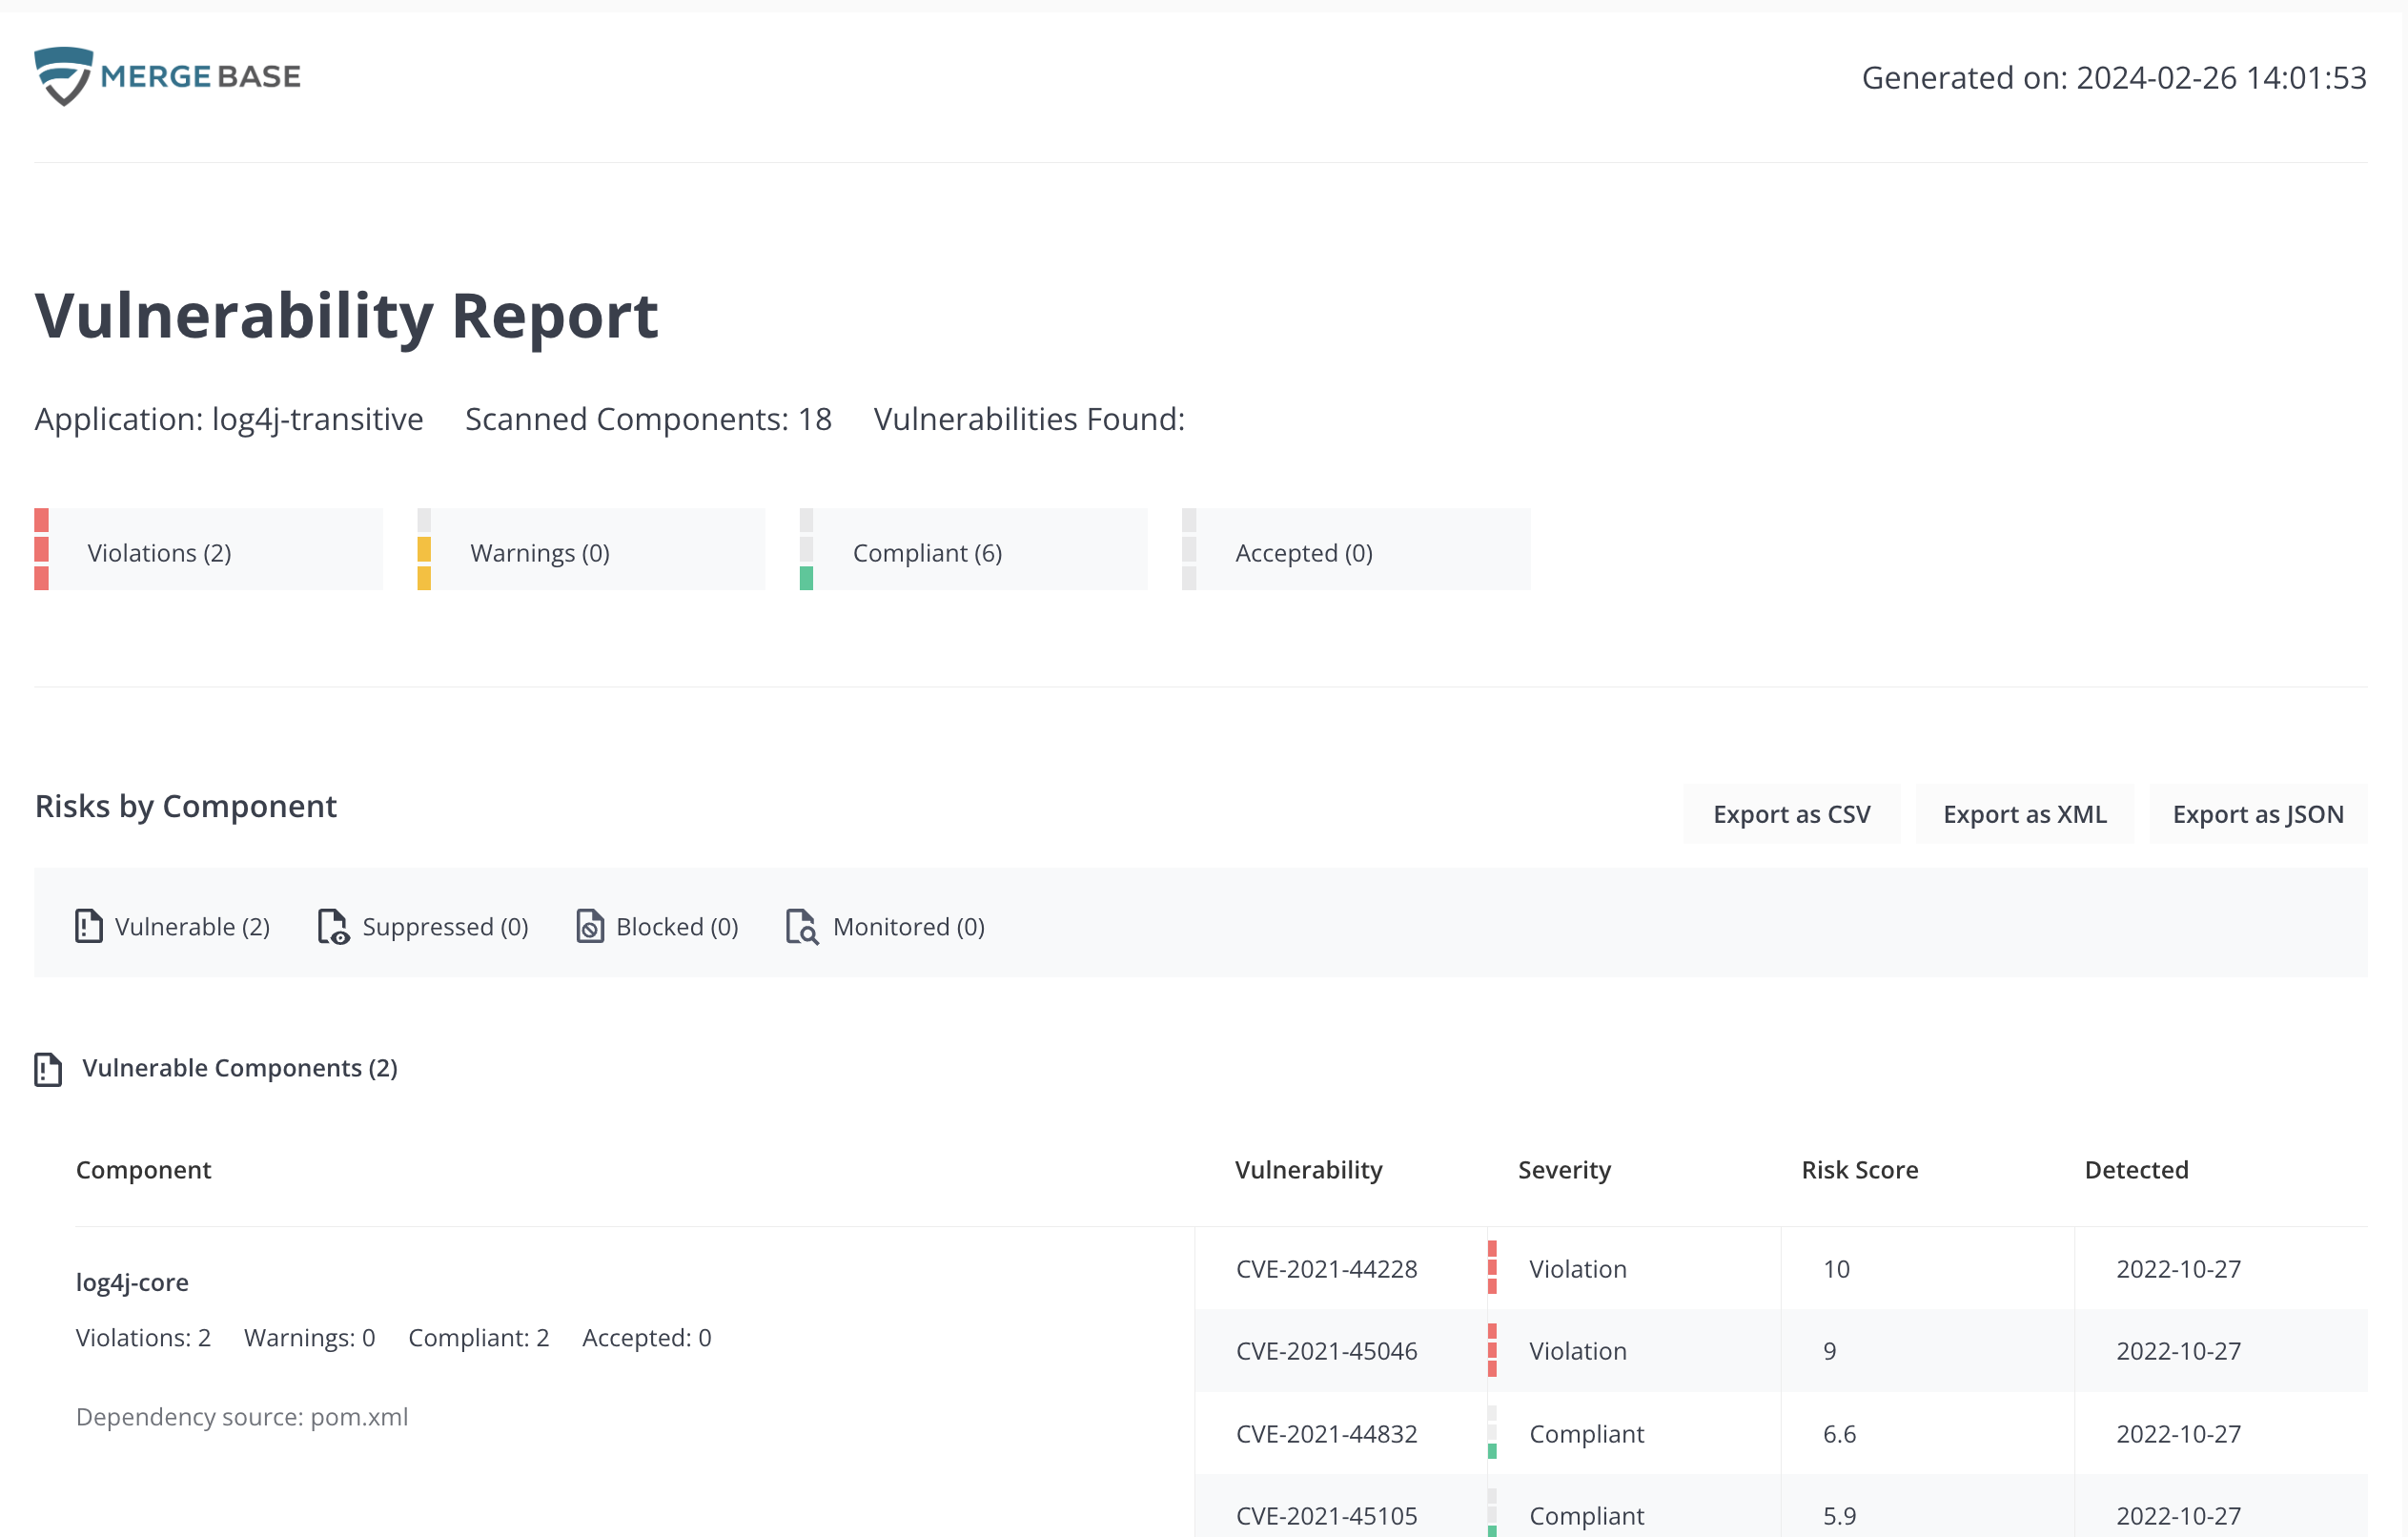
This report provides a full breakdown of vulnerable, suppressed, blocked and monitored components within your application.
Formats
The full report can be exported in CSV, XML or JSON format.
eFilters and Reports
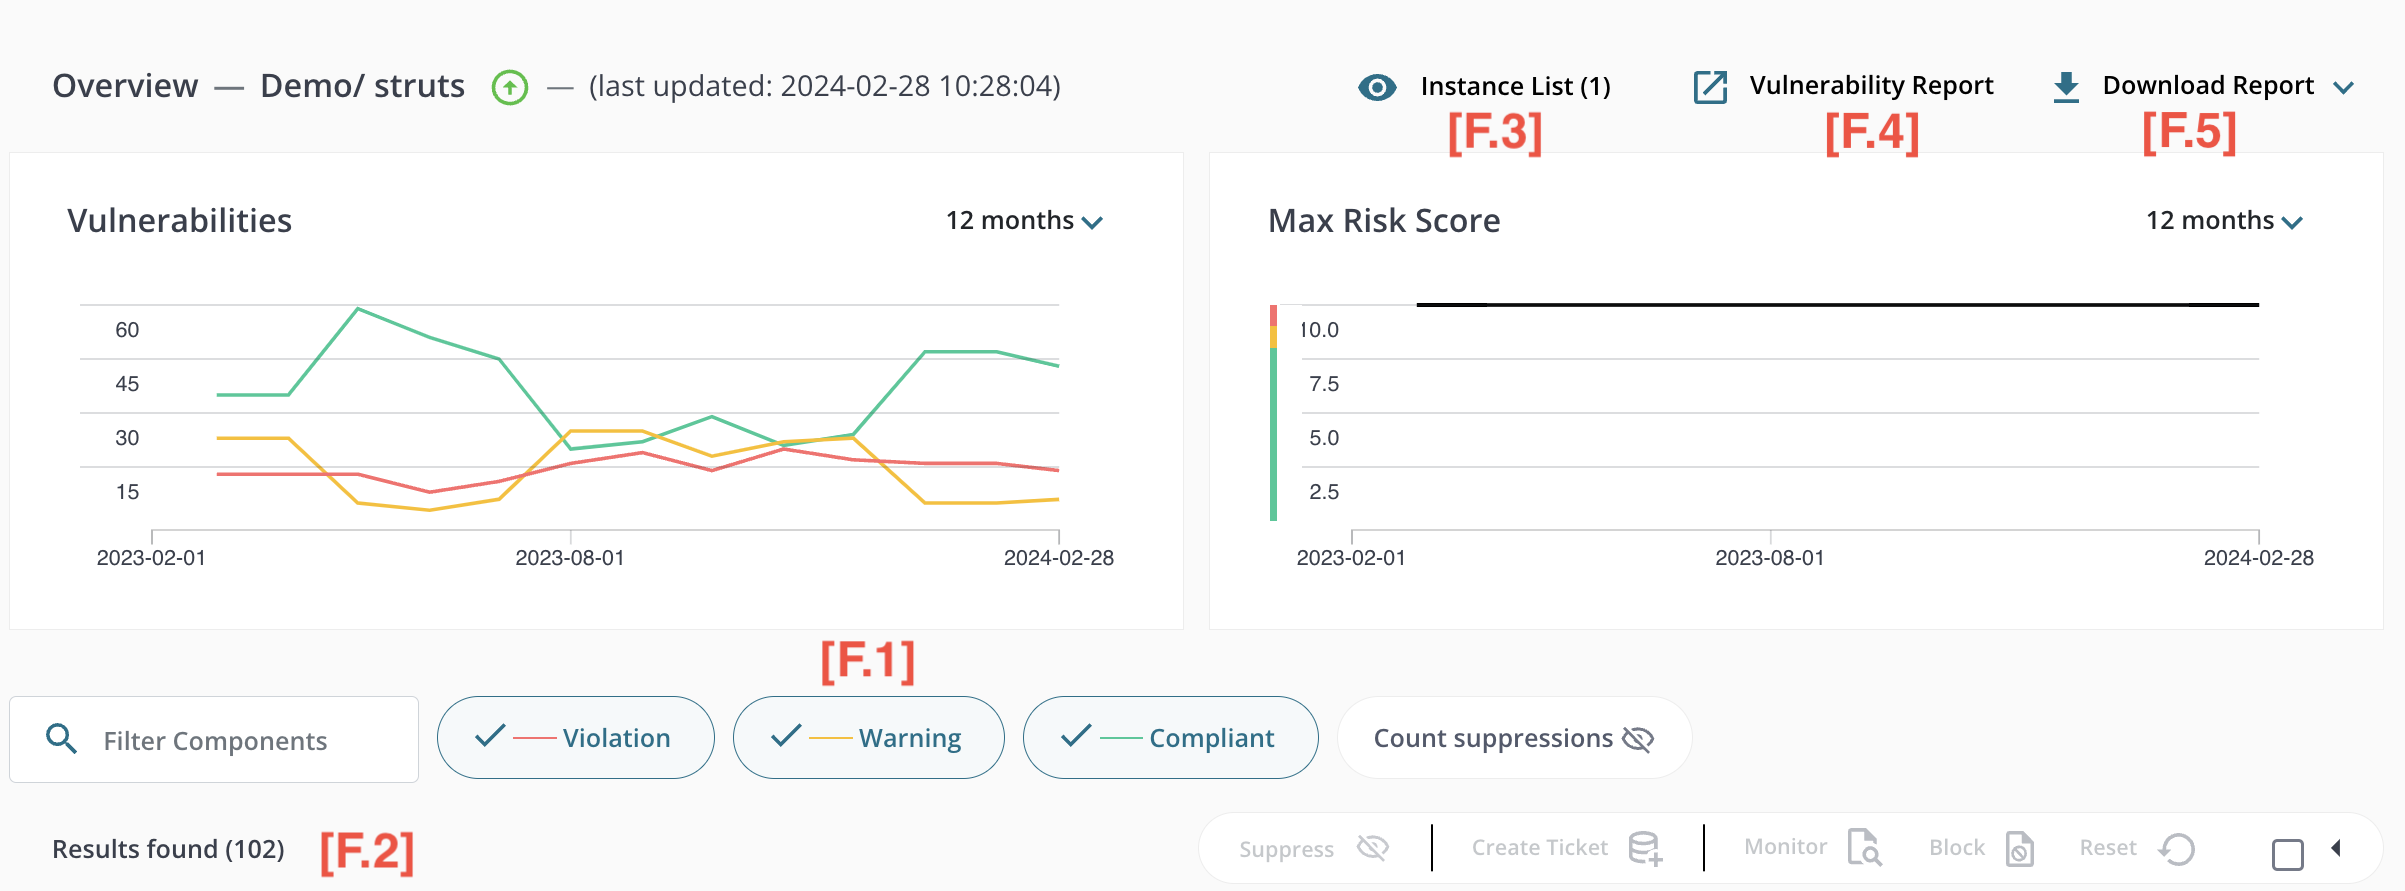
This view provides controls [F.1] to sort and filter the table [F.2] similar to the Applications Overview. The Filter Components input allows the user to filter the component list in a similar fashion to the Applications filter in the Overview. In addition, there are three checkboxes:
- Show vulnerable only - show only components that have vulnerabilities.
- Show license warnings only - show only components that are not permitted by your organization’s license policy (see License Policies in the Settings section below).
- Include mitigated and accepted risks - identical to the filter of the same name in the Applications Overview.
Finally, there are two reports: the list of active instances [F.3], vulnerability report [F.4]. The active instance report is only available for inoculated applications. Additionally, there are various other reports [F.5], including the Software Bill of Materials (SBOM) report, which provides a comprehensive overview of all software components, their dependencies, and licensing information.
If you group your applications into a single folder, an export SBOM button will appear, allowing you to generate a single SBOM for all your applications. In this case, the application name will be the name of the root component in the structure view.
Actions
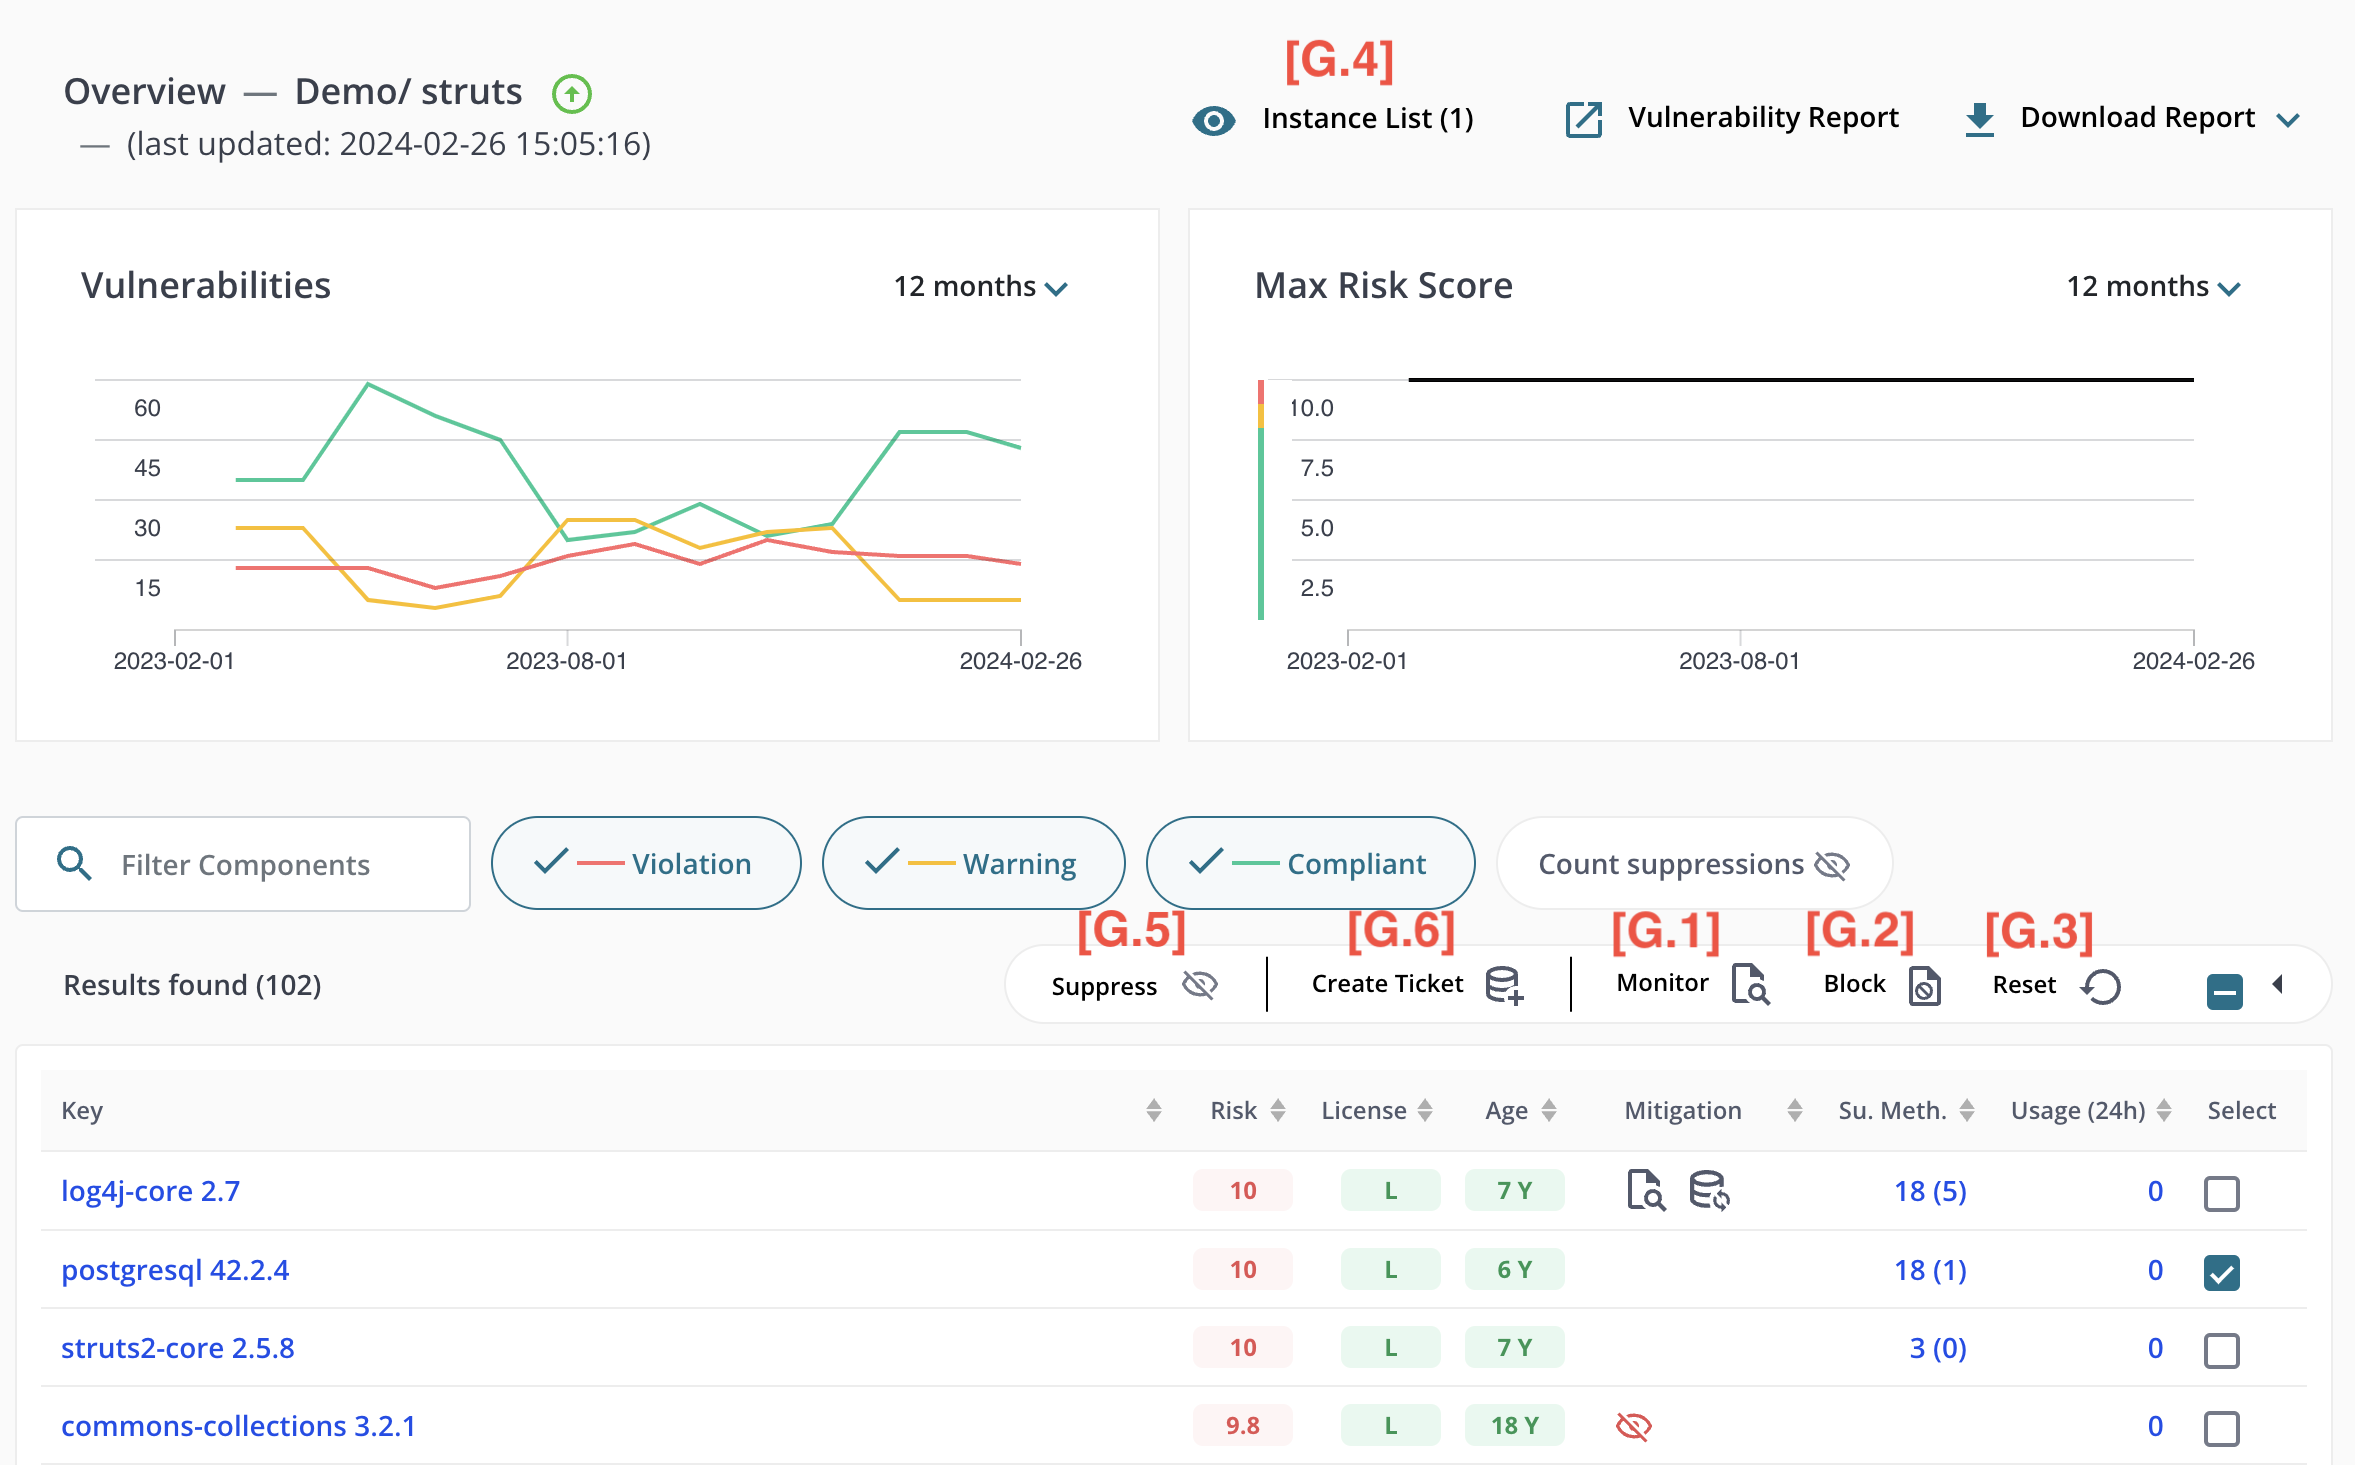
Setting a Mitigation
If the application being viewed is inoculated, the user can set mitigations on individual components. The mitigations are:
- [G.1] - Monitor: record detailed usage information for the component
- [G.2] - Block: prevent the component from being used (application users may see an error)
- [G.3] - Reset: unset all previous “monitor” and “block” mitigations previously set on the selected components.
Note that setting a mitigation may take some time to confirm while the dashboard waits for the inoculated application to acknowledge the change.
You can click on the [G.4] - Instance List to review all application instances (including IP addresses, mac addresses, etc) that would be affected by the mitigations.
Component List and Mitigation Controls
The details of the component list and mitigation controls depend on whether the application is a read-only scan or an inoculated application reporting to the dashboard in real-time.
Suppressing Vulnerabilities; Cretaing Jira Tickets
For a given component, users can temporarily suppress associated risk and license policy violations. They can also create a Jira ticket to assign and track patching work to a development team.
- [G.5] - Suppress: clicking on “Suppress” tells MergeBase to temporarily ignore (stop reporting) the current known vulnerabilities for the selected components. A reason and expiry time must be provided on the dialog box that pops up before the suppression is activated.
- [G.6] - Create Ticket: clicking on “Create Ticket” causes MergeBase to connect to your company’s Jira instance to create patching tickets for the selected components (and their corresponding vulnerabilities).
Runtime Applications
Application Detail - Inoculated Applications
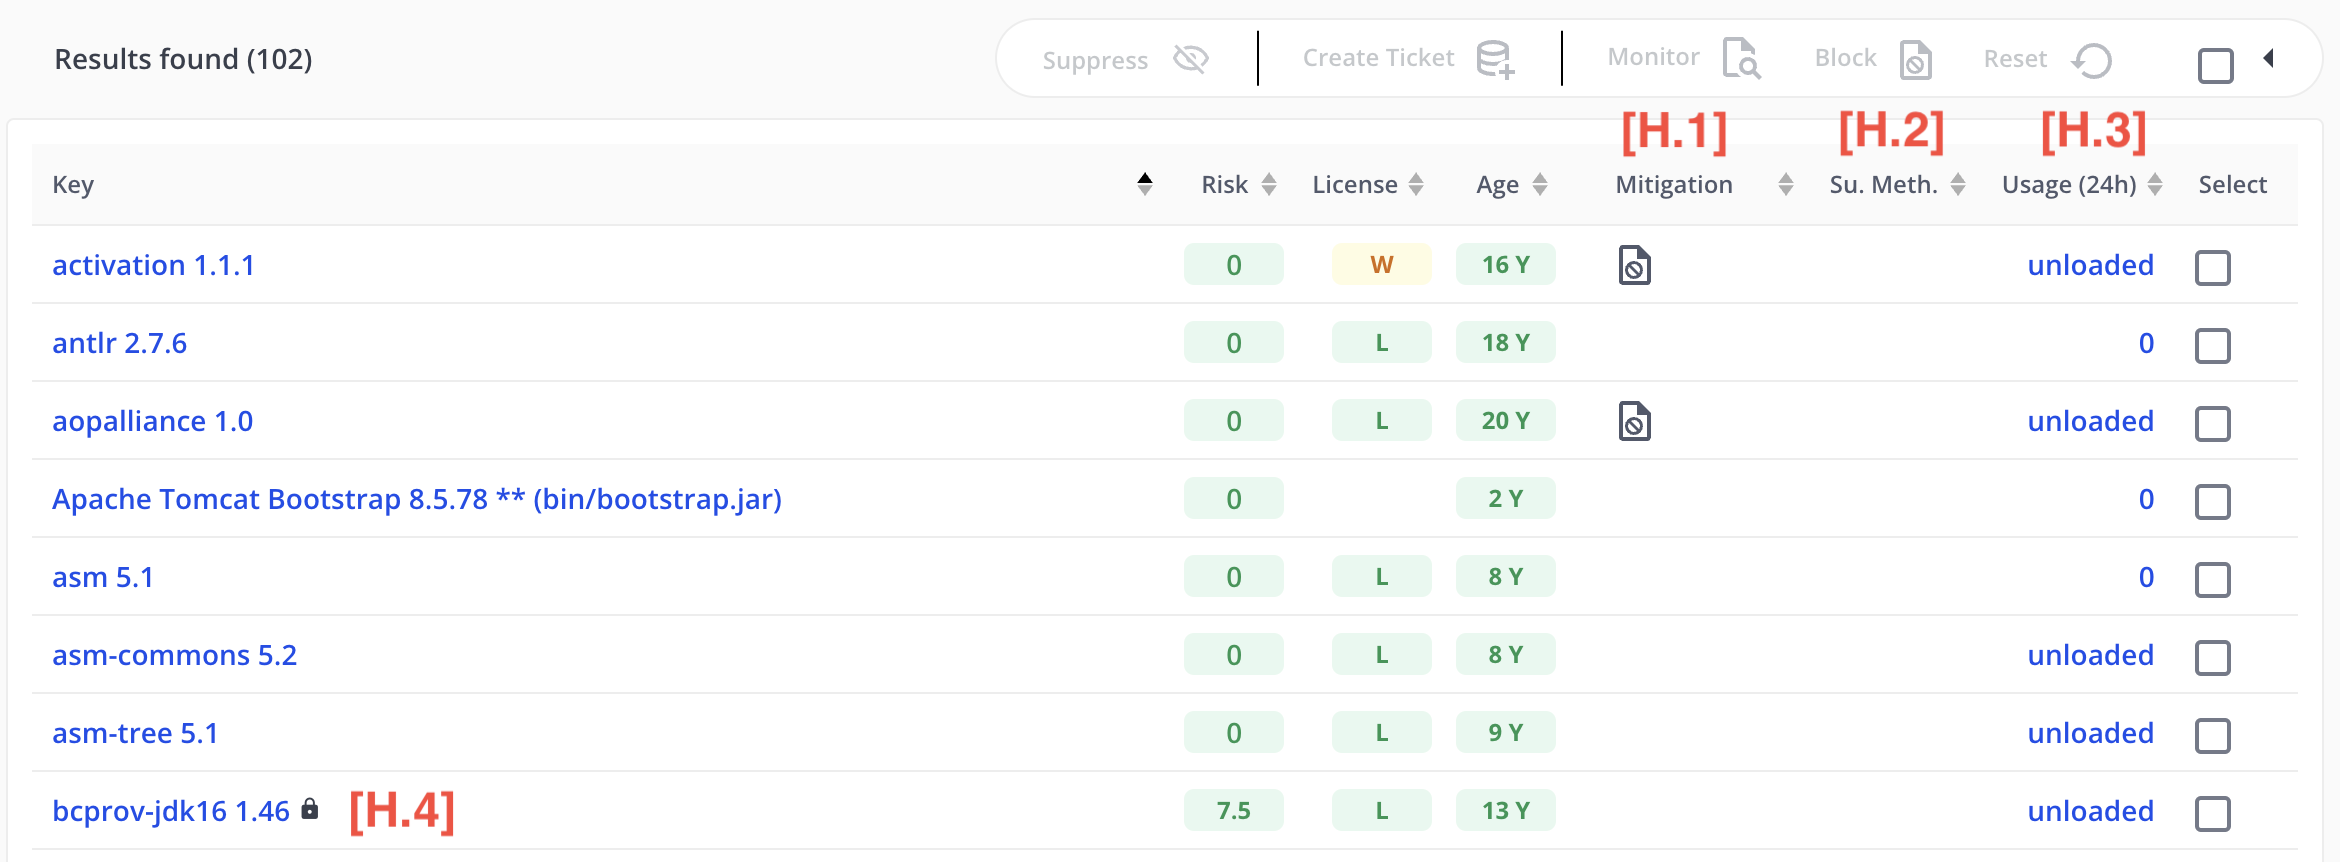
For inoculated applications, some additional information is provided:
- [H.1] - Mitigation: in addition to Jira, this column will display a mitigation status symbol if the component is monitored or blocked.
- [H.2] - Susp. Meth: the number of suspicious methods/functions (e.g., “29 (0)”). The number to the left (not in parentheses) represents the total number of suspicious methods identified. The number to the right (in parentheses) represents the number with mitigations applied (either monitoring or blocking).
- [H.3] - Usage (24h): the number of times the component was used in the past 24 hours (or “unloaded” if the component is not currently loaded within its running application)
Regarding “[H.4] - Signed Components,” both scanned and inoculated applications might include a small lock icon within the artifact-id. This indicates that the artifact is signed and cannot be inoculated by MergeBase unless a re-signing certificate is obtained. Blocking and monitoring mitigations are not available for locked (signed) components.